'%20d='M0%203h96v1h-96z'/%3E%3Cpattern%20id='d1'%20width='2'%20height='2'%20patternUnits='userSpaceOnUse'%3E%3Cpath%20fill='%23e3b02f'%20d='M0%200h1v1H0zM1%201h1v1H1z'/%3E%3C/pattern%3E%3Cpath%20fill='url(%23d1)'%20d='M0%207h96v1h-96z'/%3E%3Cpattern%20id='d2'%20width='2'%20height='2'%20patternUnits='userSpaceOnUse'%3E%3Cpath%20fill='%23c9981b'%20d='M0%200h1v1H0zM1%201h1v1H1z'/%3E%3C/pattern%3E%3Cpath%20fill='url(%23d2)'%20d='M0%2011h96v1h-96z'/%3E%3Cpattern%20id='d3'%20width='2'%20height='2'%20patternUnits='userSpaceOnUse'%3E%3Cpath%20fill='%23a57e1b'%20d='M0%200h1v1H0zM1%201h1v1H1z'/%3E%3C/pattern%3E%3Cpath%20fill='url(%23d3)'%20d='M0%2015h96v1h-96z'/%3E%3Cpath%20fill='%23FFFDFB'%20fill-opacity='.75'%20d='M29%203h1v1h-1zM71%202h1v1h-1zM9%206h1v1h-1zM50%201h1v1h-1zM24%203h1v1h-1zM36%209h1v1h-1zM94%206h1v1h-1zM53%207h1v1h-1zM36%205h1v1h-1zM54%206h1v1h-1zM25%209h1v1h-1zM73%205h1v1h-1zM74%209h1v1h-1zM60%208h1v1h-1zM75%204h1v1h-1zM40%206h1v1h-1z'/%3E%3Cpath%20fill='%2316151a'%20fill-opacity='.55'%20d='M62%205h1v1h-1zM63%205h1v1h-1zM64%205h1v1h-1zM65%205h1v1h-1zM66%205h1v1h-1zM62%206h1v1h-1zM66%206h1v1h-1zM67%206h1v1h-1zM62%207h1v1h-1zM67%207h1v1h-1zM62%208h1v1h-1zM64%208h1v1h-1zM65%208h1v1h-1zM67%208h1v1h-1zM62%209h1v1h-1zM67%209h1v1h-1zM62%2010h1v1h-1zM64%2010h1v1h-1zM65%2010h1v1h-1zM67%2010h1v1h-1zM62%2011h1v1h-1zM67%2011h1v1h-1zM62%2012h1v1h-1zM63%2012h1v1h-1zM64%2012h1v1h-1zM65%2012h1v1h-1zM66%2012h1v1h-1zM67%2012h1v1h-1z'/%3E%3Cpath%20fill='%23FFFDFB'%20d='M61%204h1v1h-1zM62%204h1v1h-1zM63%204h1v1h-1zM64%204h1v1h-1zM65%204h1v1h-1zM61%205h1v1h-1zM65%205h1v1h-1zM66%205h1v1h-1zM61%206h1v1h-1zM66%206h1v1h-1zM61%207h1v1h-1zM63%207h1v1h-1zM64%207h1v1h-1zM66%207h1v1h-1zM61%208h1v1h-1zM66%208h1v1h-1zM61%209h1v1h-1zM63%209h1v1h-1zM64%209h1v1h-1zM66%209h1v1h-1zM61%2010h1v1h-1zM66%2010h1v1h-1zM61%2011h1v1h-1zM62%2011h1v1h-1zM63%2011h1v1h-1zM64%2011h1v1h-1zM65%2011h1v1h-1zM66%2011h1v1h-1z'/%3E%3Cpath%20fill='%234f3e1a'%20d='M0%2018h7v4h-7zM7%2015h5v7h-5zM12%2019h4v3h-4zM16%2016h4v6h-4zM20%2015h4v7h-4zM24%2017h3v5h-3zM27%2017h4v5h-4zM31%2014h3v8h-3zM34%2014h3v8h-3zM37%2016h6v6h-6zM43%2018h5v4h-5zM48%2018h3v4h-3zM51%2015h7v7h-7zM58%2015h6v7h-6zM64%2019h7v3h-7zM71%2018h3v4h-3zM74%2015h3v7h-3zM77%2014h7v8h-7zM84%2014h7v8h-7zM91%2015h6v7h-6z'/%3E%3Cpath%20fill='%23F4C533'%20d='M3%2019h1v1h-1zM5%2020h1v1h-1zM9%2017h1v1h-1zM10%2020h1v1h-1zM17%2019h1v1h-1zM25%2020h1v1h-1zM28%2020h1v1h-1zM32%2020h1v1h-1zM32%2020h1v1h-1zM35%2015h1v1h-1zM35%2015h1v1h-1zM39%2017h1v1h-1zM46%2019h1v1h-1zM49%2019h1v1h-1zM49%2021h1v1h-1zM53%2017h1v1h-1zM61%2018h1v1h-1zM62%2016h1v1h-1zM66%2020h1v1h-1zM68%2020h1v1h-1zM72%2020h1v1h-1zM75%2018h1v1h-1zM75%2019h1v1h-1zM80%2017h1v1h-1zM88%2018h1v1h-1zM93%2019h1v1h-1zM94%2018h1v1h-1z'/%3E%3C/svg%3E)
In short
An AI crawler leaves a line in your server logs on every request, with the URL, the HTTP status, the bytes served and the timestamp. That is the only exhaustive measurement you have, because neither GA4 nor Search Console sees these visits. Three families share the same file, scheduled crawling that feeds an index or model training, user-triggered fetching that does not always follow robots.txt, and human traffic referred from an AI answer, which shows up in the referer rather than the user agent. The user agent proves nothing on its own since it can be spoofed, so match it against the IP ranges each vendor publishes or run a reverse DNS check. What matters next is a short list of numbers, frequency per agent, coverage of your priority pages, and the share of 403, 404 and 429 responses served to agents.
Direct answer
How do you know which pages AI crawlers visit?
Read your server logs. Every request writes one line with the client IP, the timestamp, the requested URL, the HTTP status and the user agent. Filter that file on known AI agent tokens, count lines per agent and per URL, and you get crawl frequency, the pages that are fetched, and the ones that never are.
No other tool gives you that view. Search Console only reports Googlebot, GA4 only measures a human visitor whose browser runs JavaScript, and AI crawlers generally do not run any. Logs record the request at the server level, before rendering and before any analytics consent. They are also the only source that can tell you an important page has never been requested at all, which no citation dashboard can do.
The work splits into four steps, and each answers a different question.
- Collect. Confirm your entry layer actually writes the user agent and the HTTP status, which is not guaranteed by default on every platform.
- Filter. Isolate lines whose user agent contains a known AI agent token, case insensitive.
- Aggregate. Count visits per agent, per URL and per status code, then record the last seen date for every page.
- Verify. Match client IPs against the ranges the vendor publishes before drawing any conclusion about an agent identity.
Before you open the log file. AI crawler access checker | AI crawler simulator
Distinction
Scheduled crawling, user-triggered fetches, referred humans
Three very different things land in the same log file, and mixing them up ruins the analysis. Scheduled crawling is planned by the vendor, it walks the site without any person asking for it, and it feeds either a search index or a training dataset. A user-triggered fetch starts from a question asked inside an assistant, it touches only a handful of URLs, and it is usually immediate. Referred human traffic is not a robot at all, it is a person who clicked a citation link in an AI answer, and it shows up in the referer field rather than the user agent.
Vendor documentation owns that split. OpenAI separates OAI-SearchBot, used to surface websites in ChatGPT search features, GPTBot, which serves the foundation models, and ChatGPT-User, used for certain user actions. Anthropic splits ClaudeBot, Claude-SearchBot and Claude-User the same way. Perplexity contrasts PerplexityBot, which powers search, with Perplexity-User, which answers an action inside the product.
That nuance has a direct consequence for robots.txt. OpenAI writes that robots.txt rules may not apply because the actions are initiated by a user, Perplexity states that Perplexity-User generally ignores robots.txt rules, and Google says the same about its user-triggered fetchers. Seeing one of those agents despite a blocking rule is therefore not necessarily an incident, it is documented behaviour.
| Family | User agent tokens | Trigger | robots.txt |
|---|---|---|---|
| Search crawling | OAI-SearchBot, PerplexityBot, Claude-SearchBot | Scheduled by the vendor | Followed |
| Training crawling | GPTBot, ClaudeBot | Scheduled by the vendor | Followed |
| User-triggered fetch | ChatGPT-User, Perplexity-User, Claude-User | A question asked in the assistant | May not apply |
| Referred human | Regular browser, referer chatgpt.com | Click on a citation link | Not applicable |
OpenAI, crawlers and bots | Anthropic, web crawling | Perplexity, crawlers | Google, user-triggered fetchers
Format
Which log fields do you actually need?
The combined format is enough to start, as long as you add response time. Nginx defines it out of the box with the client address, the user, the local time, the request line, the status, the body bytes, the referer and the user agent. Only one genuinely useful field is missing for crawl diagnosis, processing time, available through the request_time variable that the documentation describes as request processing time in seconds with a milliseconds resolution.
Apache exposes the same set of fields through its LogFormat directive. Its combined format carries the host, the timestamp, the request, the final status and both the Referer and User-Agent headers. Two additions are worth making, duration in microseconds with the D specifier, and bytes actually sent including headers with the O specifier, which requires the mod_logio module.
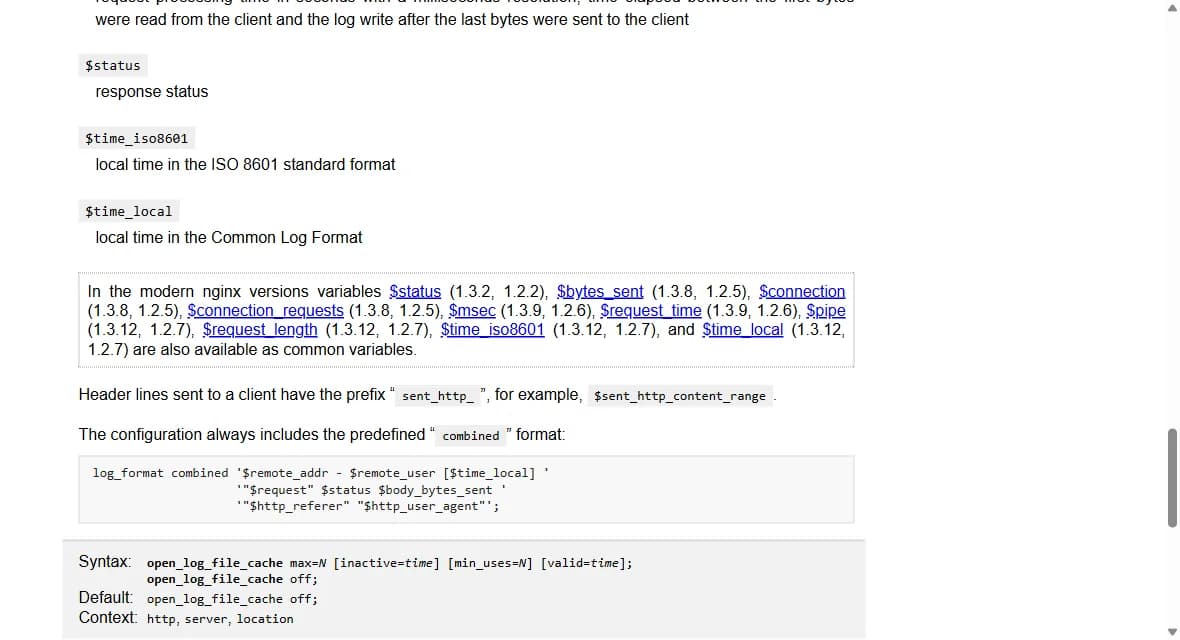
# nginx.conf, le format combined enrichi de la latence de réponse
log_format ai_agents '$remote_addr - $remote_user [$time_local] '
                     '"$request" $status $body_bytes_sent '
                     '"$http_referer" "$http_user_agent" $request_time';

access_log /var/log/nginx/access.log ai_agents;
nginx, ngx_http_log_module | Apache, log files | Apache, mod_log_config
Apache
The same log under Apache
Under Apache the logic is identical and only the syntax changes. Declare a named format, then point CustomLog at it. Keep the final status with the greater-than modifier, otherwise an internal redirect makes you record the status of the original request rather than the one actually served.
# httpd.conf, combined enrichi des octets réels et de la durée
LogFormat "%h %l %u %t \"%r\" %>s %O \"%{Referer}i\" \"%{User-Agent}i\" %D" ai_agents
CustomLog logs/access_log ai_agents
Queries
Reusable filters and queries
These commands carry no customer data and work on any combined format file. Field 9 is the HTTP status and field 7 is the requested URL in that format, which makes aggregation direct. Adapt the token list to your market, an English language site will mostly see OpenAI, Google, Perplexity, Anthropic and Microsoft.
The sixth command is the most useful and the least often run. It compares the URLs actually fetched against your list of priority pages and returns the difference, in other words the pages no AI agent has ever come for. Content that is never crawled cannot be indexed or cited, whatever its editorial quality.
AI='GPTBot|OAI-SearchBot|OAI-AdsBot|ChatGPT-User|ClaudeBot|Claude-User|Claude-SearchBot|PerplexityBot|Perplexity-User|Googlebot|GoogleOther|bingbot|meta-externalagent'

# 1. Every AI agent visit, all statuses
grep -Ei "$AI" access.log

# 2. Volume per agent, busiest first
grep -Eio "$AI" access.log | sort | uniq -c | sort -rn

# 3. Only the error responses served to an agent
grep -Ei "$AI" access.log | awk '$9 ~ /^(403|404|429|500|503)$/'

# 4. Top 20 URLs crawled by GPTBot
grep -i 'GPTBot' access.log | awk '{print $7}' | sort | uniq -c | sort -rn | head -20

# 5. Last recorded visit for one agent
grep -i 'ClaudeBot' access.log | tail -1

# 6. Priority pages never visited, by diffing against the sitemap
grep -Ei "$AI" access.log | awk '{print $7}' | sort -u > seen.txt
comm -23 priority-urls.txt seen.txt
To build the priority page list. llms.txt generator | Site agent
Verification
Why the user agent alone is not proof
A user agent header is a free text string chosen by the client. Anyone can send a request declaring itself GPTBot, and your log will record it as such. A log line is therefore never proof that a vendor visited, it only proves a request claimed that identity. As long as you stay at the level of trend counting, the approximation is acceptable. The moment you decide to block, to charge, or to serve different content, it no longer is.
Two documented methods settle the question. The first is matching the client IP against the ranges the vendor publishes. OpenAI publishes one file per bot, Anthropic publishes a single list, Perplexity publishes one file per crawler. The second is a reverse DNS lookup followed by a forward one, the method Google documents for Googlebot, where the address must resolve to a name under googlebot.com, google.com or googleusercontent.com, and that name must then resolve back to the original address.
A third path is emerging. Web Bot Auth has the bot sign its requests with the Signature, Signature-Input and Signature-Agent headers, built on HTTP Message Signatures from RFC 9421 and on Ed25519 keys. Verification becomes cryptographic and no longer depends on an address list you have to keep current. Cloudflare already implements it for its verified bots, and the matching specifications are still in progress at the IETF, so adoption remains partial today.
# 1. Reverse DNS on the address found in the log
host 66.249.66.1
# 1.66.249.66.in-addr.arpa domain name pointer crawl-66-249-66-1.googlebot.com.

# 2. Forward DNS on the name returned, it must resolve back
host crawl-66-249-66-1.googlebot.com
# crawl-66-249-66-1.googlebot.com has address 66.249.66.1

# 3. Vendors that publish their ranges in CIDR form
curl -s https://openai.com/gptbot.json
curl -s https://claude.com/crawling/bots.json
curl -sL https://www.perplexity.com/perplexitybot.json| Vendor | Published method | Where to find it |
|---|---|---|
| OpenAI | IP ranges per bot | openai.com/gptbot.json, searchbot.json, chatgpt-user.json |
| Anthropic | Single IP list | claude.com/crawling/bots.json |
| Perplexity | IP ranges per crawler | perplexitybot.json and perplexity-user.json |
| Reverse then forward DNS, or range files | developers.google.com, crawling/ipranges folder |
Google, verifying Googlebot | Cloudflare, Web Bot Auth | IETF, Web Bot Auth architecture
Test
Reproducing an agent visit on your own site
Before you interpret a log file, check that your chain writes what you think it writes. Send a request to your own site with a test user agent, then read back the line it produced. If the user agent is truncated, if the status belongs to an intermediate redirect, or if the request never appears because an upstream cache served it, you find out now rather than halfway through an analysis.
The capture below shows exactly that on a local server. It is a test request we sent ourselves with a user agent string imitating GPTBot, not a visit from an official crawler. Its only purpose is to prove that the log format captures the user agent, the status and the duration, and that errors show up too.
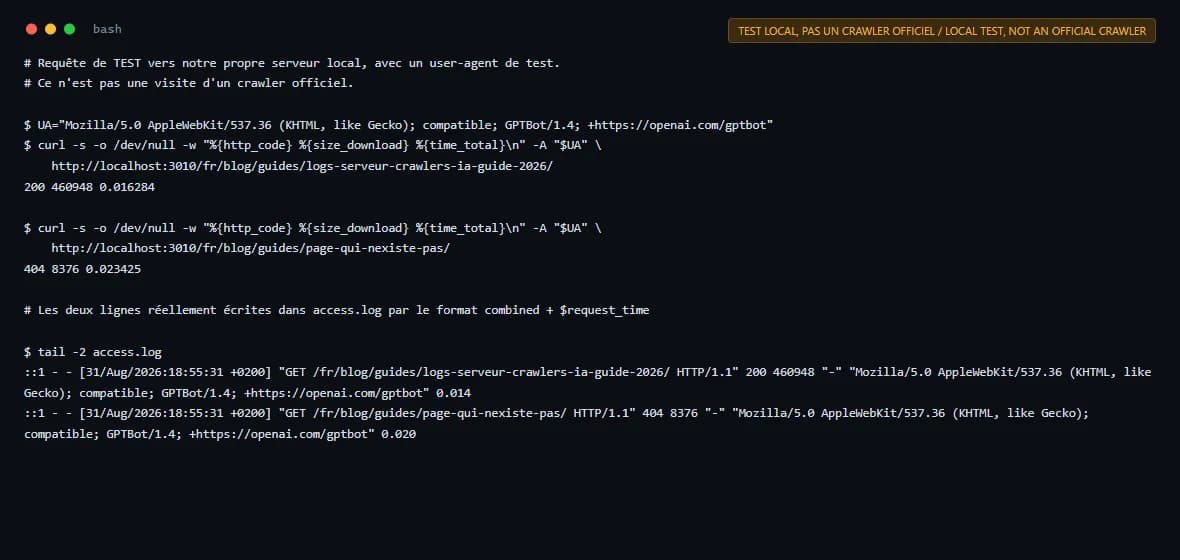
# A TEST request to our own local server, sent with a test user agent.
# This is not a visit from an official crawler.

$ UA="Mozilla/5.0 AppleWebKit/537.36 (KHTML, like Gecko); compatible; GPTBot/1.4; +https://openai.com/gptbot"
$ curl -s -o /dev/null -w "%{http_code} %{size_download} %{time_total}\n" -A "$UA" \
    http://localhost:3010/fr/blog/guides/logs-serveur-crawlers-ia-guide-2026/
200 460948 0.016284

$ curl -s -o /dev/null -w "%{http_code} %{size_download} %{time_total}\n" -A "$UA" \
    http://localhost:3010/fr/blog/guides/page-qui-nexiste-pas/
404 8376 0.023425

# The two lines actually written to access.log by the combined format + $request_time

$ tail -2 access.log
::1 - - [31/Aug/2026:18:55:31 +0200] "GET /fr/blog/guides/logs-serveur-crawlers-ia-guide-2026/ HTTP/1.1" 200 460948 "-" "Mozilla/5.0 AppleWebKit/537.36 (KHTML, like Gecko); compatible; GPTBot/1.4; +https://openai.com/gptbot" 0.014
::1 - - [31/Aug/2026:18:55:31 +0200] "GET /fr/blog/guides/page-qui-nexiste-pas/ HTTP/1.1" 404 8376 "-" "Mozilla/5.0 AppleWebKit/537.36 (KHTML, like Gecko); compatible; GPTBot/1.4; +https://openai.com/gptbot" 0.020
Diagnosis
Spotting 403, 404, 429, redirects and challenges
The status code is the highest yield field in the file, because it says what the agent actually received. A 200 on an empty page is no better than a 404, and a repeated 403 across a whole section almost always points to a web application firewall rule or an anti-bot protection blocking an agent you believed you were allowing.
The 429 deserves particular attention. RFC 6585 defines it as the response to a client that has sent too many requests in a given amount of time, with an optional Retry-After header telling it how long to wait. Served in volume to a crawler, it slows exploration and delays discovery of your new pages. Anthropic documents support for the non-standard Crawl-delay extension in robots.txt, a cleaner way to pace a crawler than rejecting it with a 429.
| Code | What the agent sees | Common cause | Action |
|---|---|---|---|
| 200 | Content served | Normal behaviour | Check the HTML carries the text, not an empty shell |
| 301 or 308 | Permanent redirect | Slash or language normalisation | Keep chains down to a single hop |
| 403 | Access denied | Firewall rule, anti-bot protection, geoblocking | Allow the agent at the firewall, not only in robots.txt |
| 404 | Page missing | Dead internal link or stale sitemap URL | Fix the internal links and clean the sitemap |
| 429 | Too many requests | Rate limit set too tight | Widen the limit or publish a Crawl-delay |
| 503 | Service unavailable | Saturated origin or maintenance | Watch the correlation with crawl spikes |
Layers
Nginx, CDN, firewall and host, what each layer sees
A request crosses several layers and each one logs only part of the story. The CDN sees all traffic, including what it serves from cache and what will therefore never reach your origin. The origin server only sees requests that made it through. If you analyse origin logs alone behind an aggressive CDN, you systematically underestimate crawler activity.
On Vercel, runtime logs expose the method, the requested path, the status, the region, the cache state and the request user agent. Two limits matter. First, static requests only appear when they serve cache, and the documentation points to Log Drains to get all static requests. Second, retention is short, one hour on Hobby, one day on Pro, three days on Enterprise, and thirty days with Observability Plus. A thirty day crawl analysis therefore implies an export, not a dashboard lookup.
On Cloudflare, the HTTP requests dataset covers exactly what a crawl analysis needs, including ClientRequestUserAgent, ClientIP, ClientRequestPath, EdgeResponseStatus, EdgeResponseBytes and EdgeTimeToFirstByteMs. Bot Management customers also get BotScore and VerifiedBotCategory. Cloudflare also offers AI Crawl Control, formerly AI Audit, which shows which AI services access your content and works on all plans.
| Layer | What it records | Limit to know |
|---|---|---|
| CDN or reverse proxy | Every request, cache hits included | Retention and export often paid features |
| Web application firewall | Blocked requests and challenges | A block never reaches the origin log |
| Origin server | Requests that got past the cache | Underestimates real crawl volume |
| Application platform | Functions and middleware, status and user agent | Partial static coverage, short retention |
Vercel, runtime logs | Cloudflare, HTTP log fields | Cloudflare, AI Crawl Control
Measurement
The minimal dashboard
A useful AI crawl report fits in nine columns. They answer the only questions that matter, namely who comes, where, how often, with what result, and what stays unvisited. Anything beyond that list is comfort, not diagnosis.
Two indicators deserve to be tracked over time rather than read as a single value. Priority page coverage, meaning the share of your strategic URLs fetched at least once in the period, measures your real exposure. The error rate served to agents tends to degrade quietly after a firewall update or a CDN plan change, and a sudden rise almost always explains a drop in visits the following week.
| Column | Log field | What it is for |
|---|---|---|
| Agent | normalised user_agent | Separate search, training and user action |
| URL | request line | Know which pages are actually read |
| Date and time | time_local | Spot spikes and crawl windows |
| Status | status | Detect 403, 404, 429 and redirects |
| Bytes | body_bytes_sent | Spot a page served empty or truncated |
| Latency | request_time | See whether slowness is limiting crawling |
| Frequency | aggregation | Visits per agent per day |
| Last seen | aggregation | Identify pages dropping out |
| Priority coverage | sitemap join | Share of strategic pages never visited |
Control
Checking what an agent actually receives
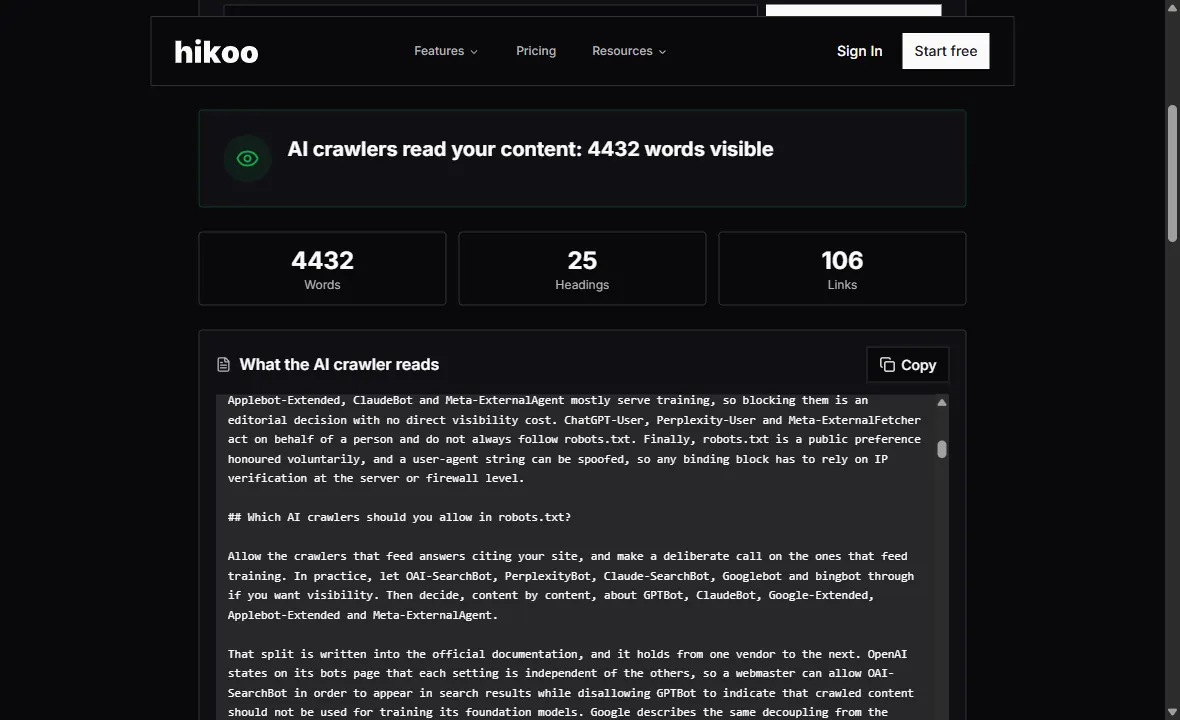
A 200 in the logs does not tell you what was served. A page can respond correctly and still contain only an HTML shell whose text arrives after JavaScript runs, which most AI crawlers do not do. The log gives you the status, the simulator gives you the content.
In the capture below we submitted a public page from our own blog to the Hikoo AI crawler simulator. The result shows the number of words actually readable, the count of headings and links, and the raw text as an agent receives it. Always cross the two, a 200 status in the log and a sane word count in the simulator.
Tools used. AI crawler simulator | AI crawler access checker | Free AI audit
Data
Privacy, retention and anonymisation
An access.log contains IP addresses, therefore personal data as soon as human visitors appear in it. A crawl analysis, however, needs no identifying data once identity verification is done. Treat verification and analysis as two separate stages, the first on raw short lived data, the second on an aggregated set you can keep longer.
- Set an explicit retention period for raw logs and automate the purge, your host default retention is not a policy.
- Anonymise the IP after verification, for example by truncating the last octet in IPv4 and the trailing segments in IPv6.
- Keep only the normalised agent, the URL, the timestamp, the status, the bytes and the latency for crawl analysis.
- Strip query parameters from aggregated URLs, they often carry session or campaign identifiers.
- Document the purpose and the duration in your processing record, a technical analysis is still processing.
- Restrict raw log access to people with an operational need, and log those accesses.
Hikoo
Tracking AI agent traffic without a log pipeline
Manual analysis answers a one off question. It holds up badly over time, because you have to collect, deduplicate, verify identities, keep history beyond the platform retention window, and redo the exercise after every infrastructure change.
Hikoo ships AI agent tracking inside the dashboard. It records AI crawler visits to your site, when they come, how often and which pages they read, agent by agent. That view sits alongside the Reporting agent, which measures how your brand is cited in AI answers. The two answer different questions, one tells you what agents read on your site, the other tells you what they say about you elsewhere.
Putting them together is where the value is. A heavily crawled page that is never cited is a content problem, a page that is never crawled is a technical problem, and only reading both together lets you decide. Hikoo's Site agent completes the picture by scoring how readable each page is for retrieval.
Keep going. Reporting agent | Site agent | robots.txt and AI crawlers | Prepare your site for AI agents | Measure AI traffic in GA4 | AI visibility
Frequently asked questions
Can I see AI crawlers in Google Analytics instead of the logs?
No. GA4 relies on a JavaScript tag running in a browser, while AI crawlers fetch the HTML without executing that script. GA4 does measure humans arriving from an AI answer, through the referer. The two measurements complement each other and do not replace each other.
How often does an AI crawler come back to a page?
No vendor publishes a guaranteed frequency, and it varies with the site, content freshness and domain authority. Your own logs are the only reliable source on this. Measure the median interval between two visits, per agent and per section, rather than looking for a general rule.
Does a log line with GPTBot prove OpenAI visited?
No. The user agent is declarative and can be spoofed in one command. To settle it, match the client IP against the ranges OpenAI publishes, or use reverse DNS where the vendor documents that method. Without verification, a line only proves that a request claimed that identity.
Why does an agent fetch a page robots.txt disallows?
Because user-triggered agents are not always covered. OpenAI states that robots.txt rules may not apply to actions initiated by a user, and Perplexity notes that Perplexity-User generally ignores robots.txt. Check the exact token before calling it a violation.
What should I do if my logs show many 403s on AI agents?
Find the blocking rule, almost always at the web application firewall or anti-bot layer rather than in robots.txt. Allowing an agent in robots.txt is useless if an upstream layer refuses the connection. Then retest the affected URL with a test user agent to confirm the fix.
How long should I keep logs for this analysis?
Keep raw logs only as long as verification requires, then keep an aggregated, anonymised set for history. On a managed platform, check retention before relying on it, since it can be measured in hours. A scheduled export to storage you control remains the simplest answer.
Should I block training crawlers to protect my content?
That is an editorial call, not a technical rule. Blocking GPTBot or ClaudeBot does not directly affect your presence in search answers, which depends on other tokens. A block also does not erase what has already been crawled. Decide content by content, then measure the effect in your logs.
Conclusion
Server logs remain the only exhaustive measurement of AI agent activity on your site. They tell you which pages are read, how often, with which HTTP status, and which ones stay unvisited, where classic analytics tools see nothing at all. The work comes down to enriching the log format, filtering on the right tokens, verifying identities by IP, then tracking nine columns over time.
The natural next step is to cross that technical reading with your citation data. Start with a free audit of your site to place your readability for agents, then track both crawler visits and brand citations in Hikoo. Putting the two side by side is what tells you what to fix first.
Sources
- 1OpenAI Crawlers and bots, OAI-SearchBot, GPTBot, ChatGPT-User. OpenAI developer documentation, consulted 31 August 2026
- 2Anthropic Does Anthropic crawl data from the web and how can site owners block the crawler. Anthropic support documentation, consulted 31 August 2026
- 3Perplexity PerplexityBot and Perplexity-User. Perplexity documentation, consulted 31 August 2026
- 4Google Verifying Googlebot and other Google crawlers. Google Search Central, consulted 31 August 2026
- 5Google Google user-triggered fetchers. Google crawler documentation, consulted 31 August 2026
- 6nginx Module ngx_http_log_module, log_format and combined. nginx documentation, consulted 31 August 2026
- 7The Apache Software Foundation Log Files, Common and Combined Log Format. Apache HTTP Server 2.4 documentation, consulted 31 August 2026
- 8The Apache Software Foundation mod_log_config, custom log formats. Apache HTTP Server 2.4 documentation, consulted 31 August 2026
- 9Vercel Runtime Logs, fields, filters and retention limits. Vercel documentation, consulted 31 August 2026
- 10Cloudflare HTTP requests log fields. Cloudflare Logs reference, consulted 31 August 2026
- 11Cloudflare AI Crawl Control, formerly AI Audit. Cloudflare documentation, consulted 31 August 2026
- 12Cloudflare Web Bot Auth, cryptographic bot verification. Cloudflare bot solutions documentation, consulted 31 August 2026
- 13T. Meunier HTTP Message Signatures for automated traffic, architecture. IETF Internet-Draft, consulted 31 August 2026
- 14M. Nottingham, R. Fielding, J. Reschke RFC 6585, Additional HTTP Status Codes. IETF, 2012
- 15A. Backman, J. Richer, M. Sporny RFC 9421, HTTP Message Signatures. IETF, 2024

'%20d='M0%204h48v1h-48z'/%3E%3Cpattern%20id='d1'%20width='2'%20height='2'%20patternUnits='userSpaceOnUse'%3E%3Cpath%20fill='%23e2ad26'%20d='M0%200h1v1H0zM1%201h1v1H1z'/%3E%3C/pattern%3E%3Cpath%20fill='url(%23d1)'%20d='M0%209h48v1h-48z'/%3E%3Cpattern%20id='d2'%20width='2'%20height='2'%20patternUnits='userSpaceOnUse'%3E%3Cpath%20fill='%23c2931b'%20d='M0%200h1v1H0zM1%201h1v1H1z'/%3E%3C/pattern%3E%3Cpath%20fill='url(%23d2)'%20d='M0%2014h48v1h-48z'/%3E%3Cpattern%20id='d3'%20width='2'%20height='2'%20patternUnits='userSpaceOnUse'%3E%3Cpath%20fill='%239d781b'%20d='M0%200h1v1H0zM1%201h1v1H1z'/%3E%3C/pattern%3E%3Cpath%20fill='url(%23d3)'%20d='M0%2019h48v1h-48z'/%3E%3Cpath%20fill='%23FFFDFB'%20fill-opacity='.75'%20d='M8%207h1v1h-1zM22%207h1v1h-1zM12%208h1v1h-1zM38%203h1v1h-1zM22%204h1v1h-1zM34%200h1v1h-1zM8%204h1v1h-1zM36%207h1v1h-1zM45%200h1v1h-1z'/%3E%3Cpath%20fill='%2316151a'%20fill-opacity='.55'%20d='M11%203h2v2h-2zM13%203h2v2h-2zM15%203h2v2h-2zM17%203h2v2h-2zM19%203h2v2h-2zM11%205h2v2h-2zM19%205h2v2h-2zM21%205h2v2h-2zM11%207h2v2h-2zM21%207h2v2h-2zM11%209h2v2h-2zM15%209h2v2h-2zM17%209h2v2h-2zM21%209h2v2h-2zM11%2011h2v2h-2zM21%2011h2v2h-2zM11%2013h2v2h-2zM15%2013h2v2h-2zM17%2013h2v2h-2zM21%2013h2v2h-2zM11%2015h2v2h-2zM21%2015h2v2h-2zM11%2017h2v2h-2zM13%2017h2v2h-2zM15%2017h2v2h-2zM17%2017h2v2h-2zM19%2017h2v2h-2zM21%2017h2v2h-2z'/%3E%3Cpath%20fill='%23FFFDFB'%20d='M10%202h2v2h-2zM12%202h2v2h-2zM14%202h2v2h-2zM16%202h2v2h-2zM18%202h2v2h-2zM10%204h2v2h-2zM18%204h2v2h-2zM20%204h2v2h-2zM10%206h2v2h-2zM20%206h2v2h-2zM10%208h2v2h-2zM14%208h2v2h-2zM16%208h2v2h-2zM20%208h2v2h-2zM10%2010h2v2h-2zM20%2010h2v2h-2zM10%2012h2v2h-2zM14%2012h2v2h-2zM16%2012h2v2h-2zM20%2012h2v2h-2zM10%2014h2v2h-2zM20%2014h2v2h-2zM10%2016h2v2h-2zM12%2016h2v2h-2zM14%2016h2v2h-2zM16%2016h2v2h-2zM18%2016h2v2h-2zM20%2016h2v2h-2z'/%3E%3Cpath%20fill='%234f3e1a'%20d='M0%2022h7v5h-7zM7%2019h7v8h-7zM14%2024h6v3h-6zM20%2019h3v8h-3zM23%2021h3v6h-3zM26%2022h3v5h-3zM29%2024h4v3h-4zM33%2024h5v3h-5zM38%2021h3v6h-3zM41%2024h6v3h-6zM47%2021h6v6h-6z'/%3E%3Cpath%20fill='%23F4C533'%20d='M1%2026h1v1h-1zM9%2022h1v1h-1zM11%2023h1v1h-1zM15%2025h1v1h-1zM24%2026h1v1h-1zM27%2026h1v1h-1zM31%2025h1v1h-1zM39%2022h1v1h-1zM49%2025h1v1h-1z'/%3E%3C/svg%3E)
'%20d='M0%204h48v1h-48z'/%3E%3Cpattern%20id='d1'%20width='2'%20height='2'%20patternUnits='userSpaceOnUse'%3E%3Cpath%20fill='%23e5b63d'%20d='M0%200h1v1H0zM1%201h1v1H1z'/%3E%3C/pattern%3E%3Cpath%20fill='url(%23d1)'%20d='M0%209h48v1h-48z'/%3E%3Cpattern%20id='d2'%20width='2'%20height='2'%20patternUnits='userSpaceOnUse'%3E%3Cpath%20fill='%23d6a21b'%20d='M0%200h1v1H0zM1%201h1v1H1z'/%3E%3C/pattern%3E%3Cpath%20fill='url(%23d2)'%20d='M0%2014h48v1h-48z'/%3E%3Cpattern%20id='d3'%20width='2'%20height='2'%20patternUnits='userSpaceOnUse'%3E%3Cpath%20fill='%23b2871b'%20d='M0%200h1v1H0zM1%201h1v1H1z'/%3E%3C/pattern%3E%3Cpath%20fill='url(%23d3)'%20d='M0%2019h48v1h-48z'/%3E%3Cpath%20fill='%23FFFDFB'%20fill-opacity='.75'%20d='M44%206h1v1h-1zM15%207h1v1h-1zM28%203h1v1h-1zM39%207h1v1h-1zM44%207h1v1h-1zM13%202h1v1h-1zM22%203h1v1h-1zM26%205h1v1h-1zM19%209h1v1h-1z'/%3E%3Cpath%20fill='%2316151a'%20fill-opacity='.55'%20d='M11%203h2v2h-2zM13%203h2v2h-2zM15%203h2v2h-2zM17%203h2v2h-2zM19%203h2v2h-2zM11%205h2v2h-2zM19%205h2v2h-2zM21%205h2v2h-2zM11%207h2v2h-2zM21%207h2v2h-2zM11%209h2v2h-2zM15%209h2v2h-2zM17%209h2v2h-2zM21%209h2v2h-2zM11%2011h2v2h-2zM21%2011h2v2h-2zM11%2013h2v2h-2zM15%2013h2v2h-2zM17%2013h2v2h-2zM21%2013h2v2h-2zM11%2015h2v2h-2zM21%2015h2v2h-2zM11%2017h2v2h-2zM13%2017h2v2h-2zM15%2017h2v2h-2zM17%2017h2v2h-2zM19%2017h2v2h-2zM21%2017h2v2h-2z'/%3E%3Cpath%20fill='%23FFFDFB'%20d='M10%202h2v2h-2zM12%202h2v2h-2zM14%202h2v2h-2zM16%202h2v2h-2zM18%202h2v2h-2zM10%204h2v2h-2zM18%204h2v2h-2zM20%204h2v2h-2zM10%206h2v2h-2zM20%206h2v2h-2zM10%208h2v2h-2zM14%208h2v2h-2zM16%208h2v2h-2zM20%208h2v2h-2zM10%2010h2v2h-2zM20%2010h2v2h-2zM10%2012h2v2h-2zM14%2012h2v2h-2zM16%2012h2v2h-2zM20%2012h2v2h-2zM10%2014h2v2h-2zM20%2014h2v2h-2zM10%2016h2v2h-2zM12%2016h2v2h-2zM14%2016h2v2h-2zM16%2016h2v2h-2zM18%2016h2v2h-2zM20%2016h2v2h-2z'/%3E%3Cpath%20fill='%234f3e1a'%20d='M0%2019h5v8h-5zM5%2021h4v6h-4zM9%2020h7v7h-7zM16%2023h3v4h-3zM19%2022h7v5h-7zM26%2020h6v7h-6zM32%2021h5v6h-5zM37%2019h3v8h-3zM40%2021h7v6h-7zM47%2021h5v6h-5z'/%3E%3Cpath%20fill='%23F4C533'%20d='M1%2024h1v1h-1zM3%2021h1v1h-1zM6%2026h1v1h-1zM17%2024h1v1h-1zM23%2023h1v1h-1zM20%2026h1v1h-1zM28%2026h1v1h-1zM29%2024h1v1h-1zM35%2026h1v1h-1zM38%2020h1v1h-1zM44%2026h1v1h-1zM44%2022h1v1h-1zM50%2025h1v1h-1z'/%3E%3C/svg%3E)
'%20d='M0%204h48v1h-48z'/%3E%3Cpattern%20id='d1'%20width='2'%20height='2'%20patternUnits='userSpaceOnUse'%3E%3Cpath%20fill='%23e4b336'%20d='M0%200h1v1H0zM1%201h1v1H1z'/%3E%3C/pattern%3E%3Cpath%20fill='url(%23d1)'%20d='M0%209h48v1h-48z'/%3E%3Cpattern%20id='d2'%20width='2'%20height='2'%20patternUnits='userSpaceOnUse'%3E%3Cpath%20fill='%23d09d1b'%20d='M0%200h1v1H0zM1%201h1v1H1z'/%3E%3C/pattern%3E%3Cpath%20fill='url(%23d2)'%20d='M0%2014h48v1h-48z'/%3E%3Cpattern%20id='d3'%20width='2'%20height='2'%20patternUnits='userSpaceOnUse'%3E%3Cpath%20fill='%23ab821b'%20d='M0%200h1v1H0zM1%201h1v1H1z'/%3E%3C/pattern%3E%3Cpath%20fill='url(%23d3)'%20d='M0%2019h48v1h-48z'/%3E%3Cpath%20fill='%23FFFDFB'%20fill-opacity='.75'%20d='M3%204h1v1h-1zM39%204h1v1h-1zM9%202h1v1h-1zM36%205h1v1h-1zM23%201h1v1h-1zM27%202h1v1h-1zM45%209h1v1h-1zM3%203h1v1h-1zM38%204h1v1h-1z'/%3E%3Cpath%20fill='%2316151a'%20fill-opacity='.55'%20d='M31%203h2v2h-2zM33%203h2v2h-2zM35%203h2v2h-2zM37%203h2v2h-2zM39%203h2v2h-2zM31%205h2v2h-2zM39%205h2v2h-2zM41%205h2v2h-2zM31%207h2v2h-2zM41%207h2v2h-2zM31%209h2v2h-2zM35%209h2v2h-2zM37%209h2v2h-2zM41%209h2v2h-2zM31%2011h2v2h-2zM41%2011h2v2h-2zM31%2013h2v2h-2zM35%2013h2v2h-2zM37%2013h2v2h-2zM41%2013h2v2h-2zM31%2015h2v2h-2zM41%2015h2v2h-2zM31%2017h2v2h-2zM33%2017h2v2h-2zM35%2017h2v2h-2zM37%2017h2v2h-2zM39%2017h2v2h-2zM41%2017h2v2h-2z'/%3E%3Cpath%20fill='%23FFFDFB'%20d='M30%202h2v2h-2zM32%202h2v2h-2zM34%202h2v2h-2zM36%202h2v2h-2zM38%202h2v2h-2zM30%204h2v2h-2zM38%204h2v2h-2zM40%204h2v2h-2zM30%206h2v2h-2zM40%206h2v2h-2zM30%208h2v2h-2zM34%208h2v2h-2zM36%208h2v2h-2zM40%208h2v2h-2zM30%2010h2v2h-2zM40%2010h2v2h-2zM30%2012h2v2h-2zM34%2012h2v2h-2zM36%2012h2v2h-2zM40%2012h2v2h-2zM30%2014h2v2h-2zM40%2014h2v2h-2zM30%2016h2v2h-2zM32%2016h2v2h-2zM34%2016h2v2h-2zM36%2016h2v2h-2zM38%2016h2v2h-2zM40%2016h2v2h-2z'/%3E%3Cpath%20fill='%234f3e1a'%20d='M0%2021h6v6h-6zM6%2019h6v8h-6zM12%2023h7v4h-7zM19%2023h5v4h-5zM24%2024h6v3h-6zM30%2021h4v6h-4zM34%2021h6v6h-6zM40%2024h7v3h-7zM47%2020h4v7h-4z'/%3E%3Cpath%20fill='%23F4C533'%20d='M4%2026h1v1h-1zM7%2023h1v1h-1zM15%2024h1v1h-1zM22%2026h1v1h-1zM21%2026h1v1h-1zM28%2026h1v1h-1zM26%2026h1v1h-1zM31%2023h1v1h-1zM36%2025h1v1h-1zM45%2025h1v1h-1zM43%2026h1v1h-1zM48%2023h1v1h-1zM48%2021h1v1h-1z'/%3E%3C/svg%3E)